Spain real estate market broke the record.
Next 2008?
Not a realtor's opinion. Not a Telegram channel forecast. Mathematics, data from Spain's government databases, and AI agents that analyzed 20 years of transactions.
A realtor will say "now is a good time to buy".
Data will tell the truth.
I loaded raw data directly from INE (Instituto Nacional de Estadística) and MITMA (Ministerio de Transportes) via their APIs. No aggregators, no middlemen. Built AI agents that parsed, cleaned, and analyzed every row.
Data Loading
INE REST API + MITMA Excel files. Transactions, mortgages, prices, foreigners. Raw data without processing.
Cleaning
Province normalization, parsing 76 Excel sheets, time series alignment. AI agents processed each source.
Analysis
Seasonal decomposition, correlations, cross-lags, Granger test. Math, not intuition.
Visualization
Auto-generated charts, tables, and comparative analysis. Fully reproducible.
Record broken
109,874 transactions in Comunidad Valenciana in 2025. More than at the 2007 bubble peak.
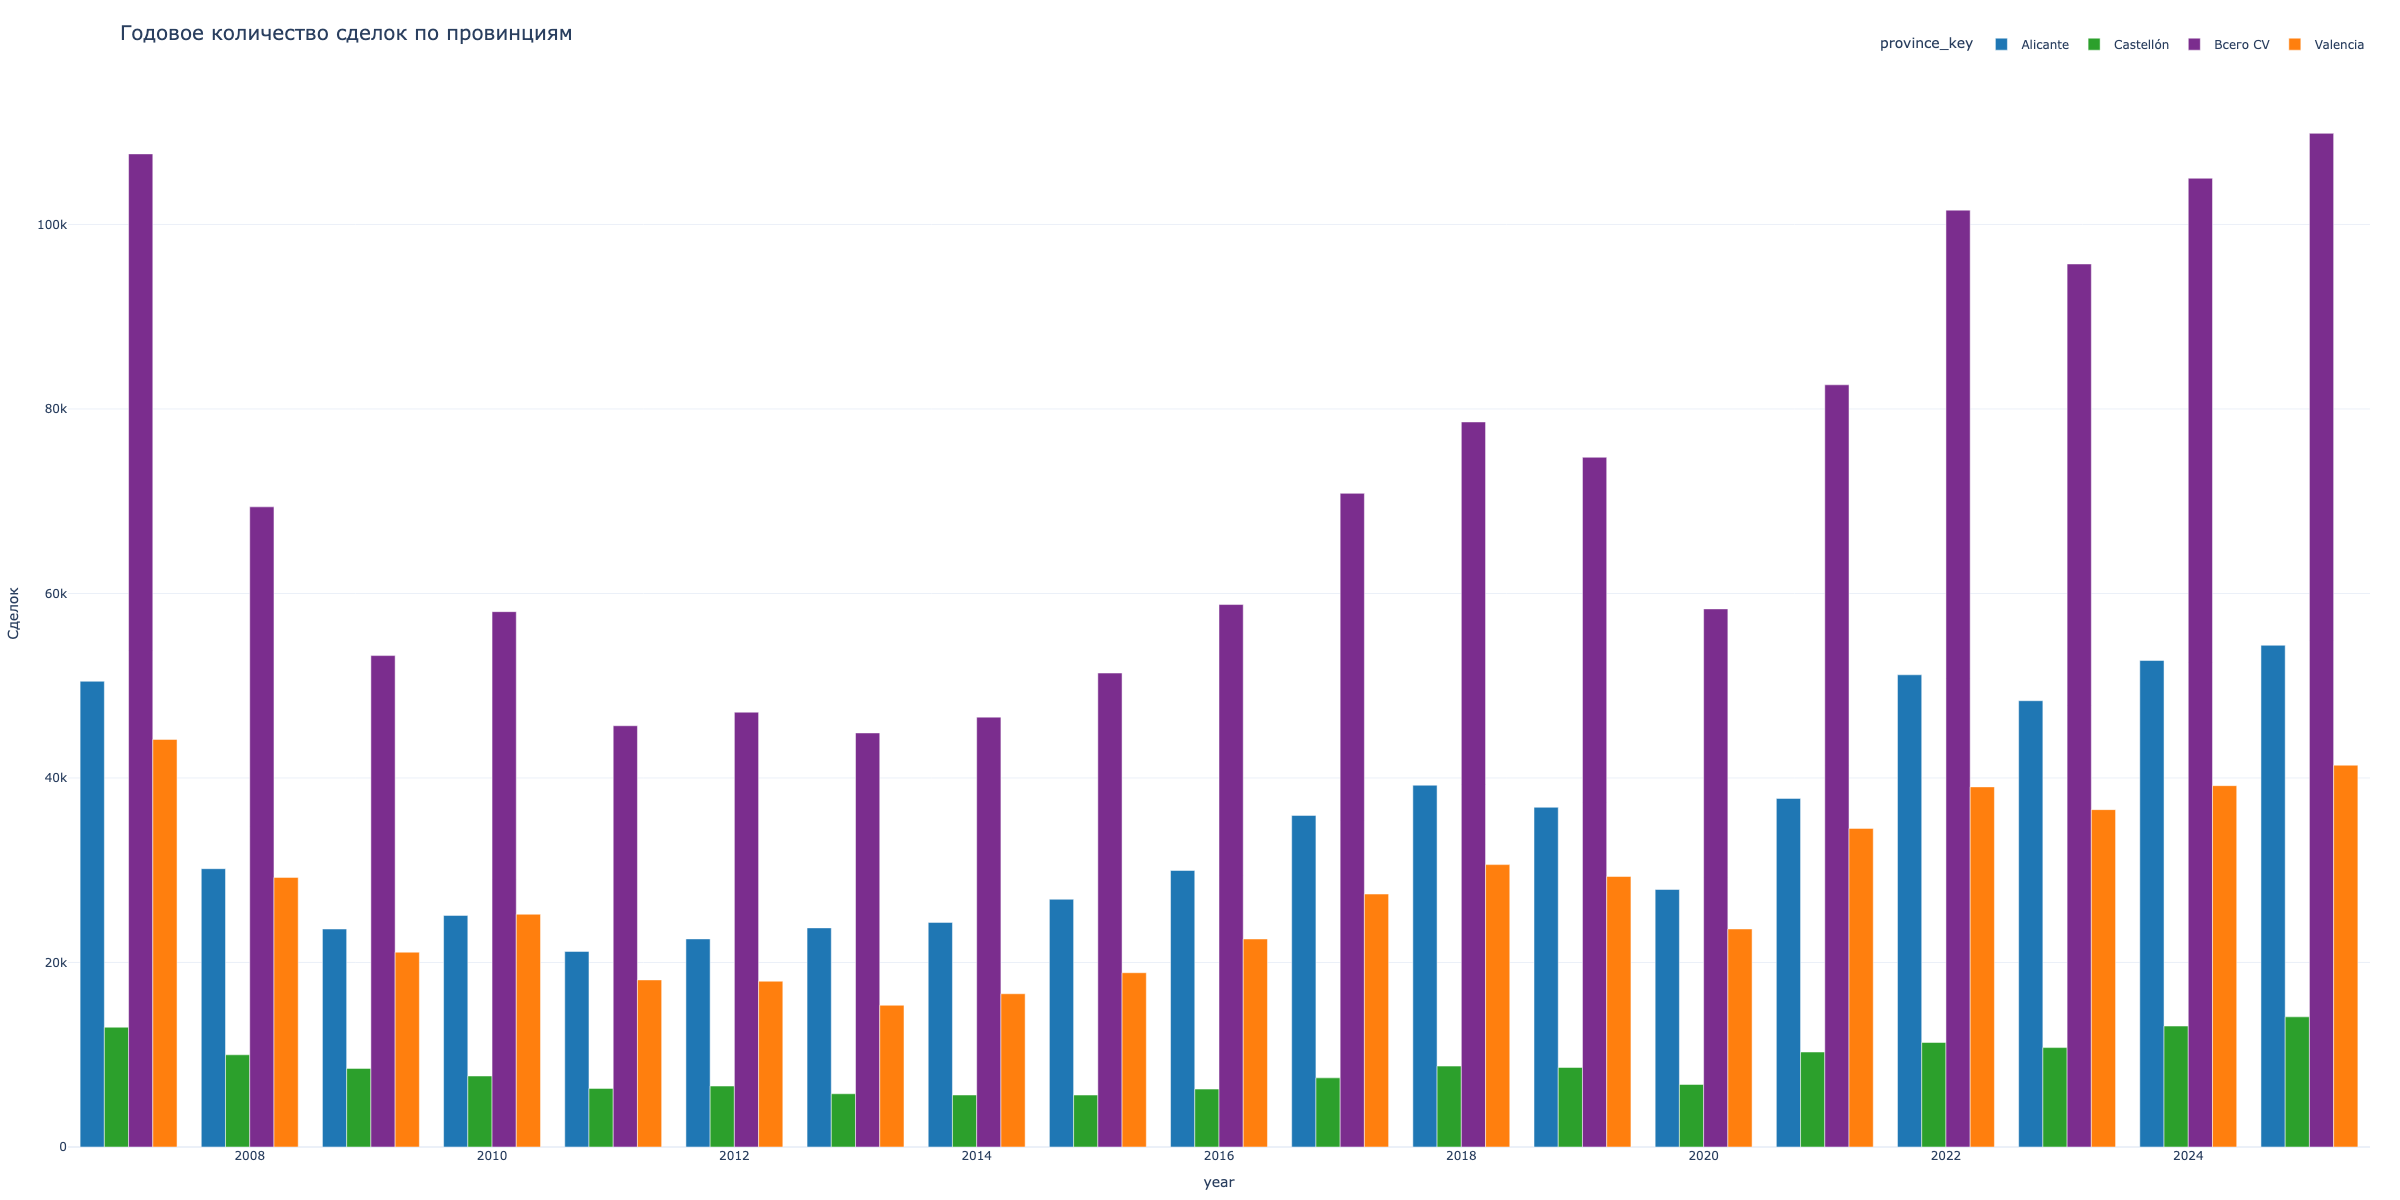
| Year | Alicante | Valencia | Castellón | Total CV |
|---|---|---|---|---|
| 2007 (peak) | 50,483 | 44,181 | 12,983 | 107,647 |
| 2008 | 30,167 | 29,225 | 9,994 | 69,386 |
| 2009 | 23,627 | 21,116 | 8,522 | 53,265 |
| 2010 | 25,102 | 25,228 | 7,697 | 58,027 |
| 2011 | 21,197 | 18,110 | 6,354 | 45,661 |
| 2012 | 22,555 | 17,969 | 6,607 | 47,131 |
| 2013 (bottom) | 23,751 | 15,362 | 5,769 | 44,882 |
| 2014 | 24,347 | 16,610 | 5,637 | 46,594 |
| 2015 | 26,852 | 18,891 | 5,630 | 51,373 |
| 2016 | 29,972 | 22,549 | 6,276 | 58,797 |
| 2017 | 35,940 | 27,417 | 7,494 | 70,851 |
| 2018 | 39,214 | 30,608 | 8,768 | 78,590 |
| 2019 | 36,822 | 29,319 | 8,620 | 74,761 |
| 2020 | 27,912 | 23,634 | 6,779 | 58,325 |
| 2021 | 37,785 | 34,537 | 10,294 | 82,616 |
| 2022 | 51,184 | 39,035 | 11,330 | 101,549 |
| 2023 | 48,374 | 36,568 | 10,774 | 95,716 |
| 2024 | 52,731 | 39,167 | 13,109 | 105,007 |
| 2025 | 54,383 | 41,384 | 14,107 | 109,874 |
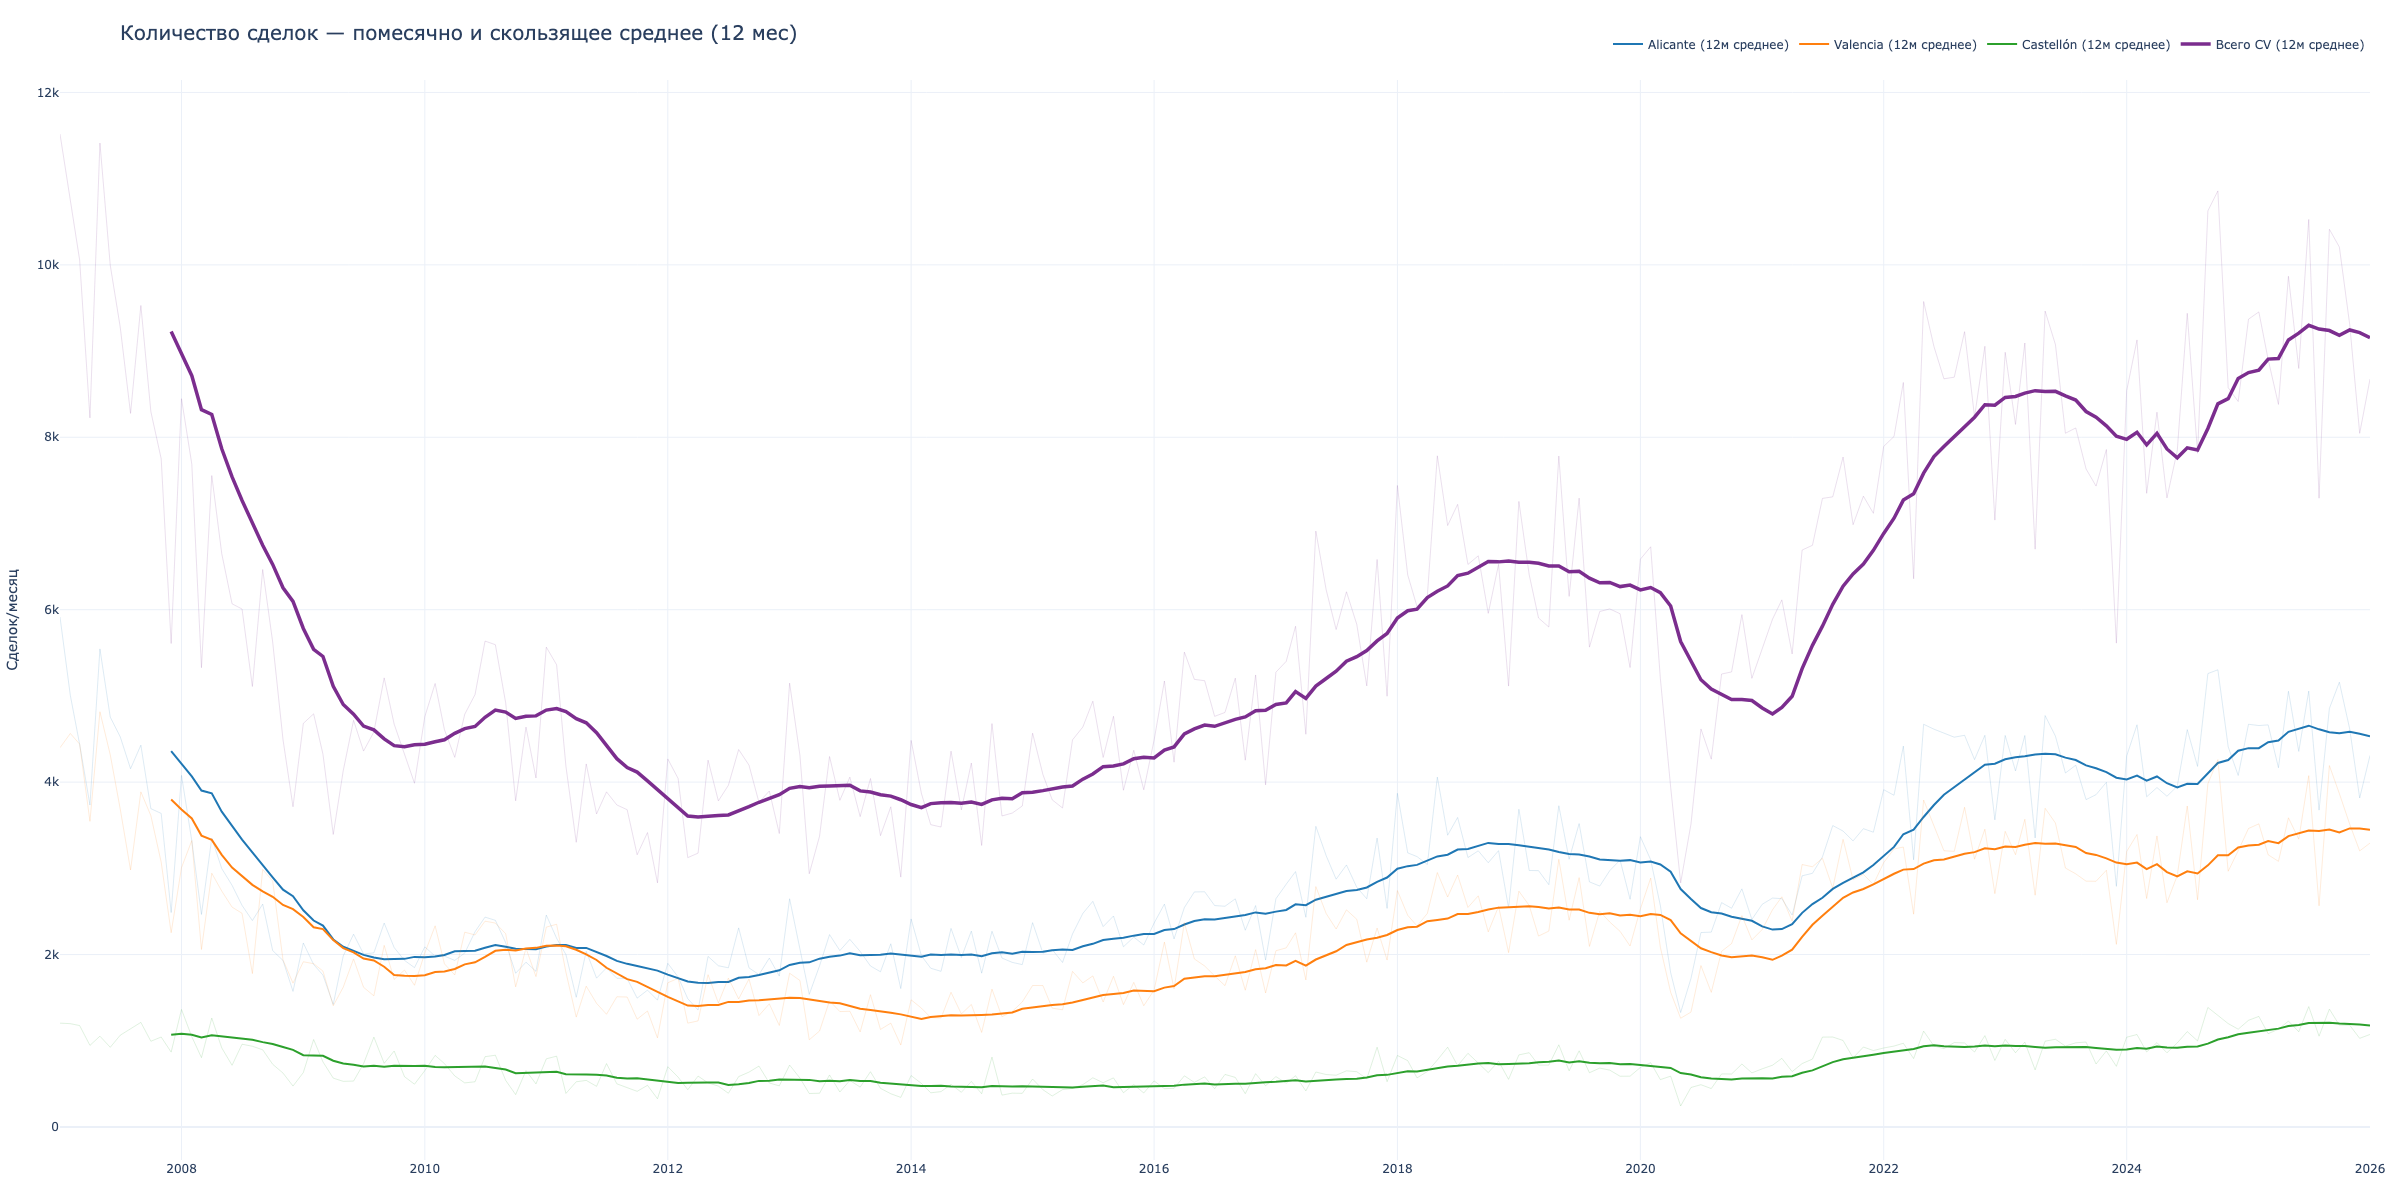
Monthly market pulse
Alicante is already more expensive than the 2008 peak
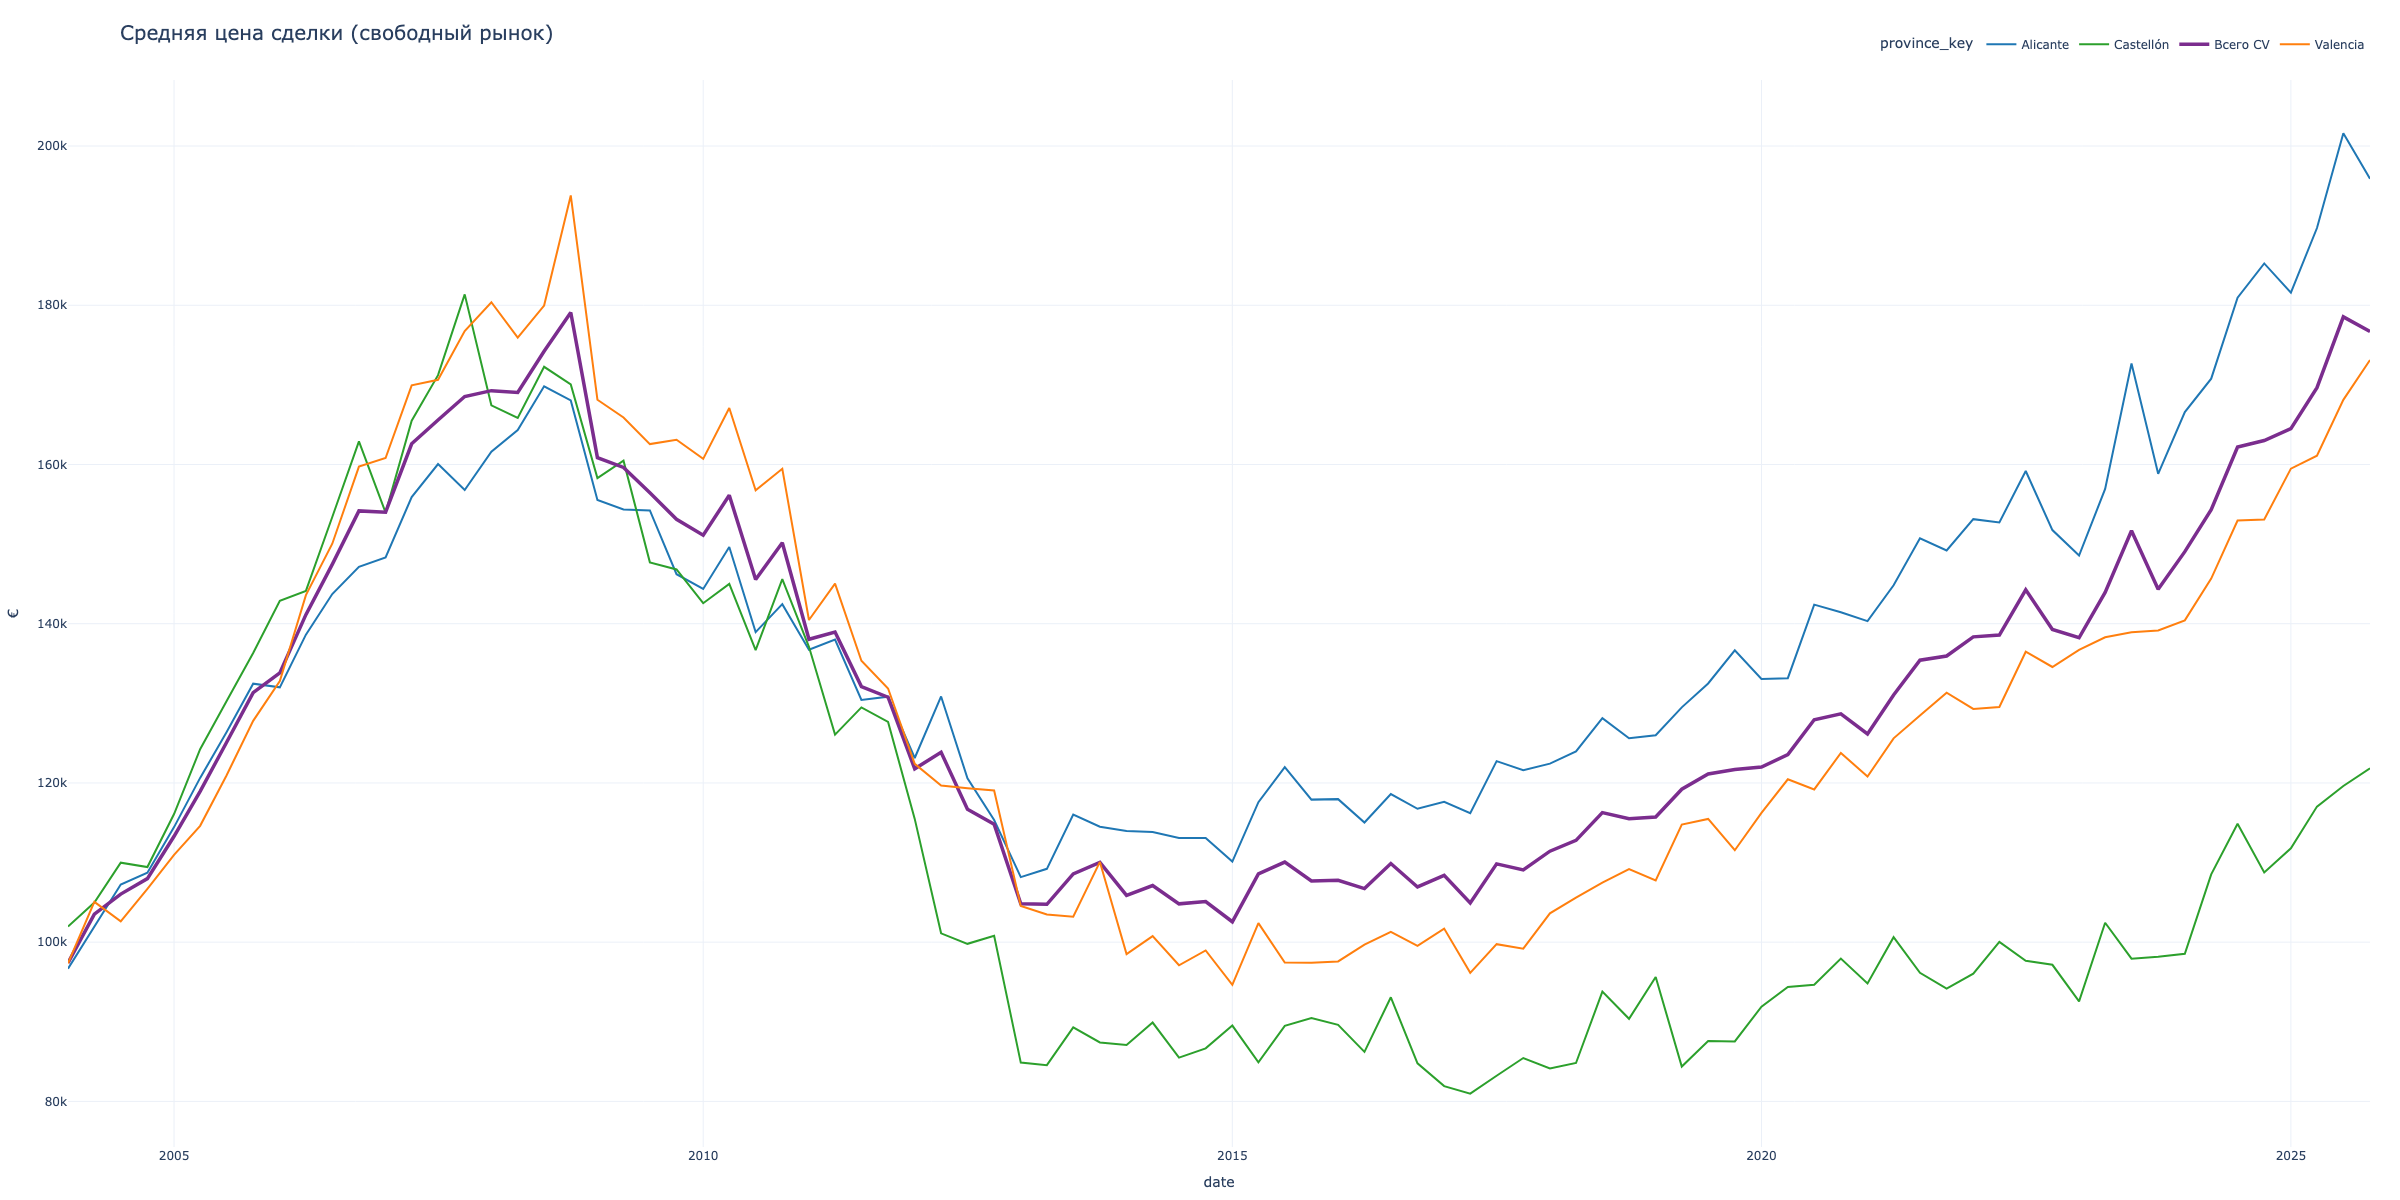
| Year | Alicante | Valencia | Castellón | Total CV |
|---|---|---|---|---|
| 2004 | €103,649 | €102,928 | €106,588 | €104,388 |
| 2005 | €123,482 | €118,583 | €126,730 | €122,932 |
| 2006 | €140,376 | €146,543 | €150,824 | €143,823 |
| 2007 | €155,270 | €169,538 | €168,009 | €162,662 |
| 2008 (peak) | €165,947 | €182,519 | €168,902 | €173,352 |
| 2009 | €152,584 | €164,925 | €153,323 | €157,595 |
| 2010 | €143,851 | €161,007 | €142,461 | €151,126 |
| 2011 | €133,998 | €138,178 | €130,080 | €135,110 |
| 2012 | €122,478 | €120,118 | €104,294 | €119,029 |
| 2013 (bottom) | €111,976 | €105,328 | €86,528 | €106,430 |
| 2014 | €113,484 | €98,831 | €87,284 | €105,091 |
| 2015 | €116,903 | €97,970 | €88,597 | €106,839 |
| 2016 | €117,088 | €99,528 | €88,421 | €107,294 |
| 2017 | €119,541 | €99,198 | €82,891 | €107,793 |
| 2018 | €125,034 | €106,476 | €88,283 | €113,706 |
| 2019 | €131,160 | €112,388 | €88,781 | €118,912 |
| 2020 | €137,517 | €119,911 | €94,717 | €125,408 |
| 2021 | €146,274 | €126,552 | €96,444 | €131,820 |
| 2022 | €154,195 | €132,473 | €97,725 | €139,545 |
| 2023 | €159,252 | €138,268 | €97,774 | €144,315 |
| 2024 | €175,887 | €148,033 | €107,673 | €156,982 |
| 2025 | €192,193 | €165,457 | €117,565 | €172,541 |
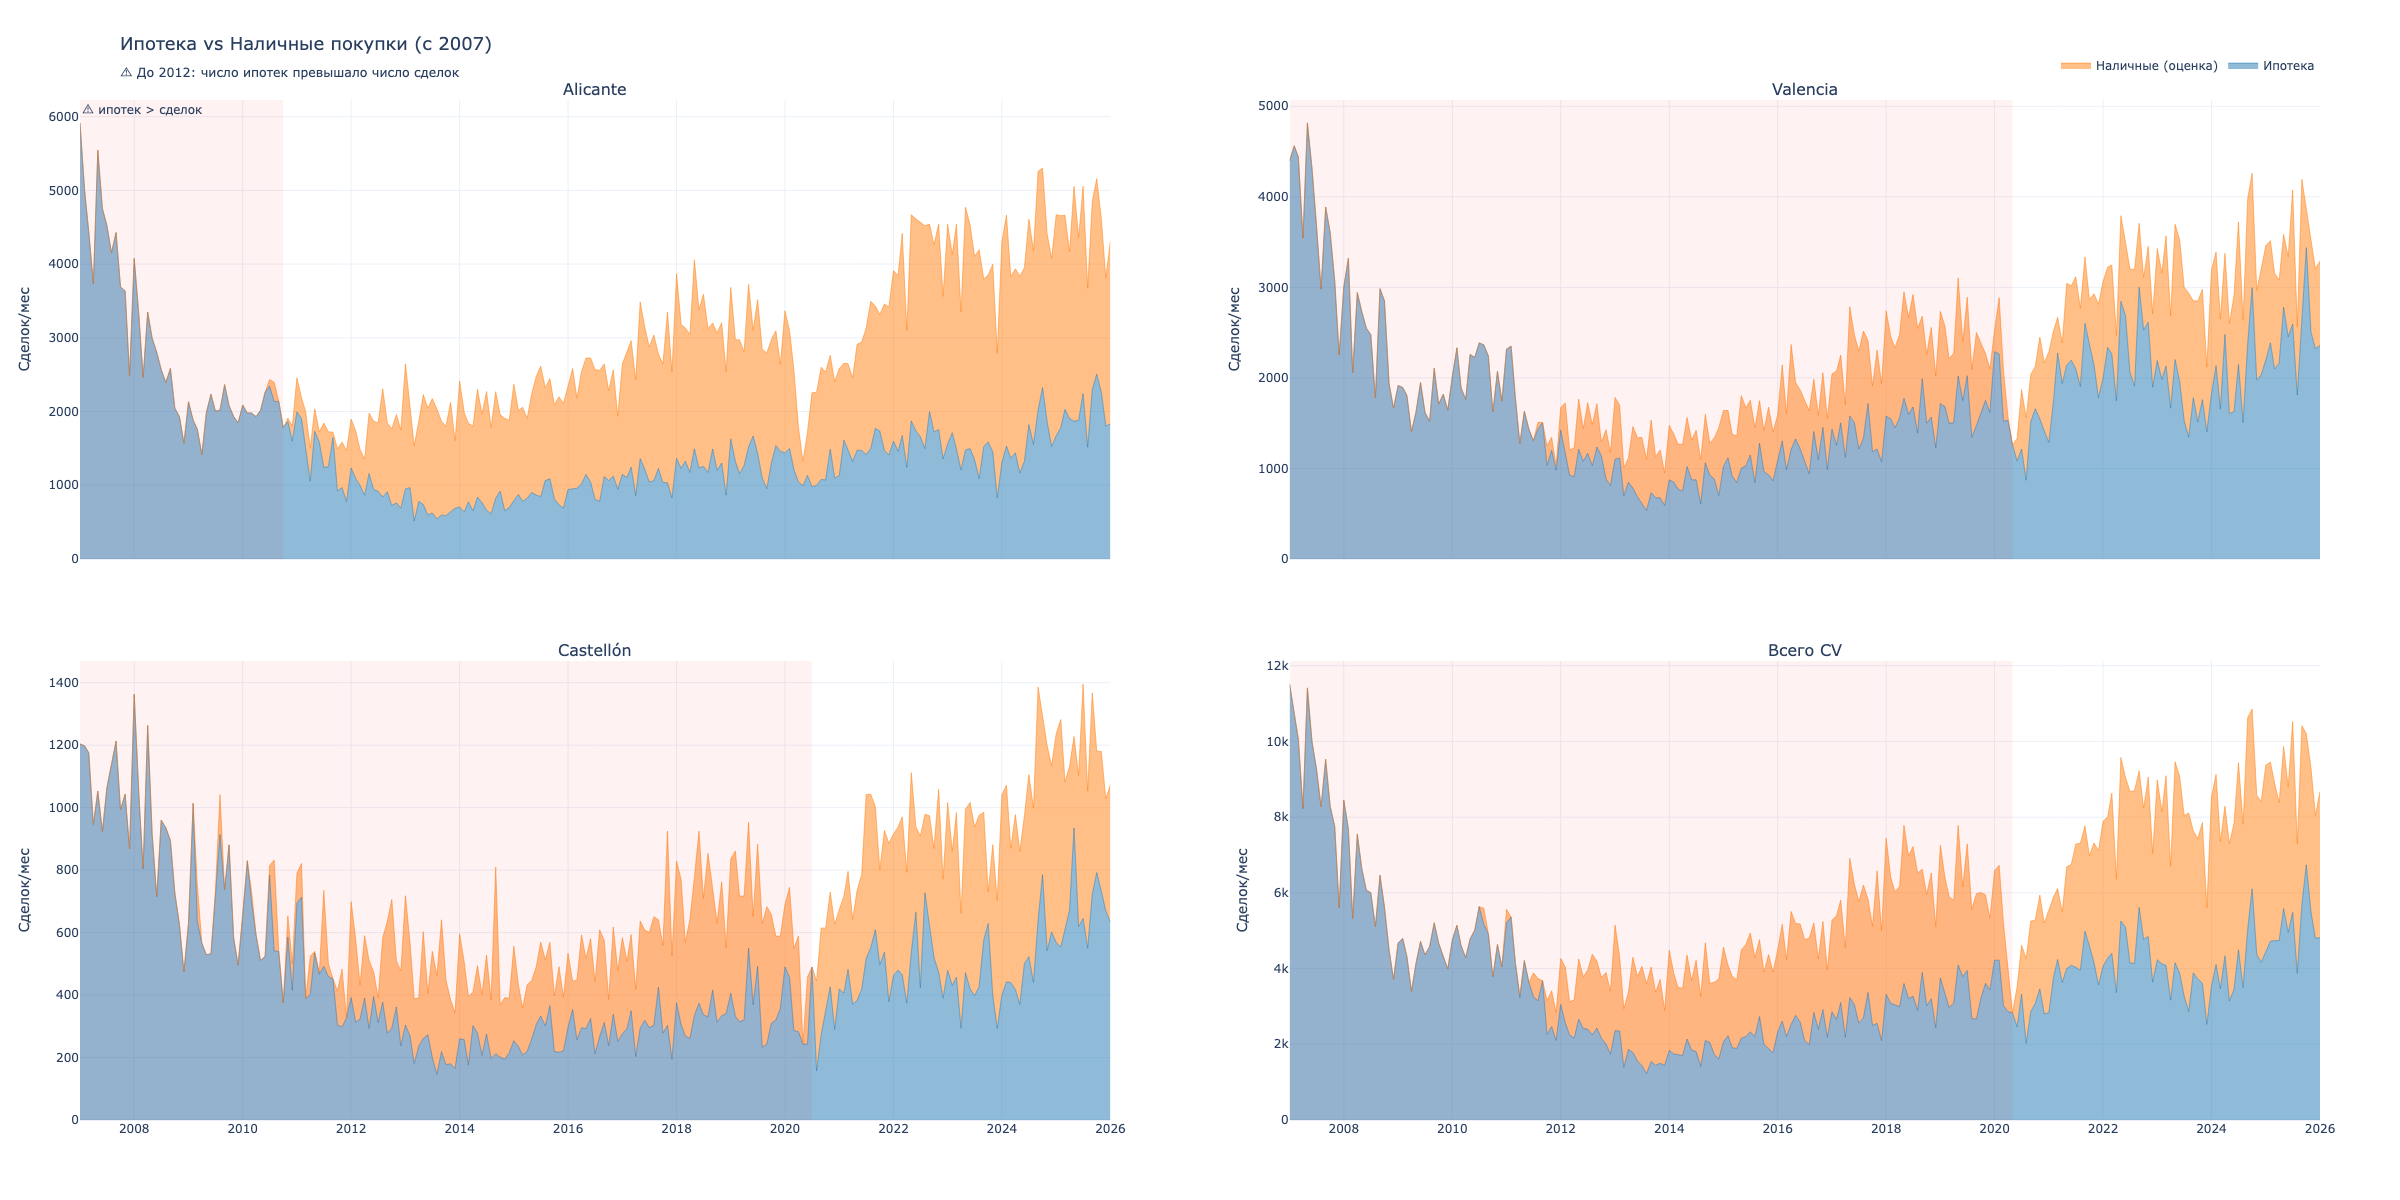
In 2007 there were twice as many mortgages as deals. Not anymore.
| Year | Alicante | Valencia | Castellón | Total CV | |
|---|---|---|---|---|---|
| 2007 | 136% | 181% | 202% | 162% | ⚠ bubble |
| 2008 | 126% | 157% | 144% | 142% | ⚠ bubble |
| 2009 | 141% | 180% | 133% | 155% | ⚠ bubble |
| 2010 | 104% | 138% | 106% | 119% | ⚠ bubble |
| 2011 | 75% | 112% | 84% | 91% | |
| 2012 | 48% | 71% | 59% | 58% | |
| 2013 | 34% | 58% | 45% | 43% | |
| 2014 | 36% | 62% | 49% | 47% | |
| 2015 | 39% | 64% | 57% | 50% | |
| 2016 | 40% | 64% | 55% | 51% | |
| 2017 | 37% | 59% | 49% | 47% | |
| 2018 | 39% | 62% | 46% | 49% | |
| 2019 | 44% | 70% | 50% | 55% | |
| 2020 | 49% | 74% | 70% | 62% | |
| 2021 | 48% | 73% | 55% | 59% | |
| 2022 | 38% | 72% | 54% | 53% | |
| 2023 | 34% | 58% | 48% | 45% | |
| 2024 | 37% | 63% | 48% | 48% | |
| 2025 | 44% | 72% | 58% | 56% |
Valencia: 72% via mortgage — classic local market.
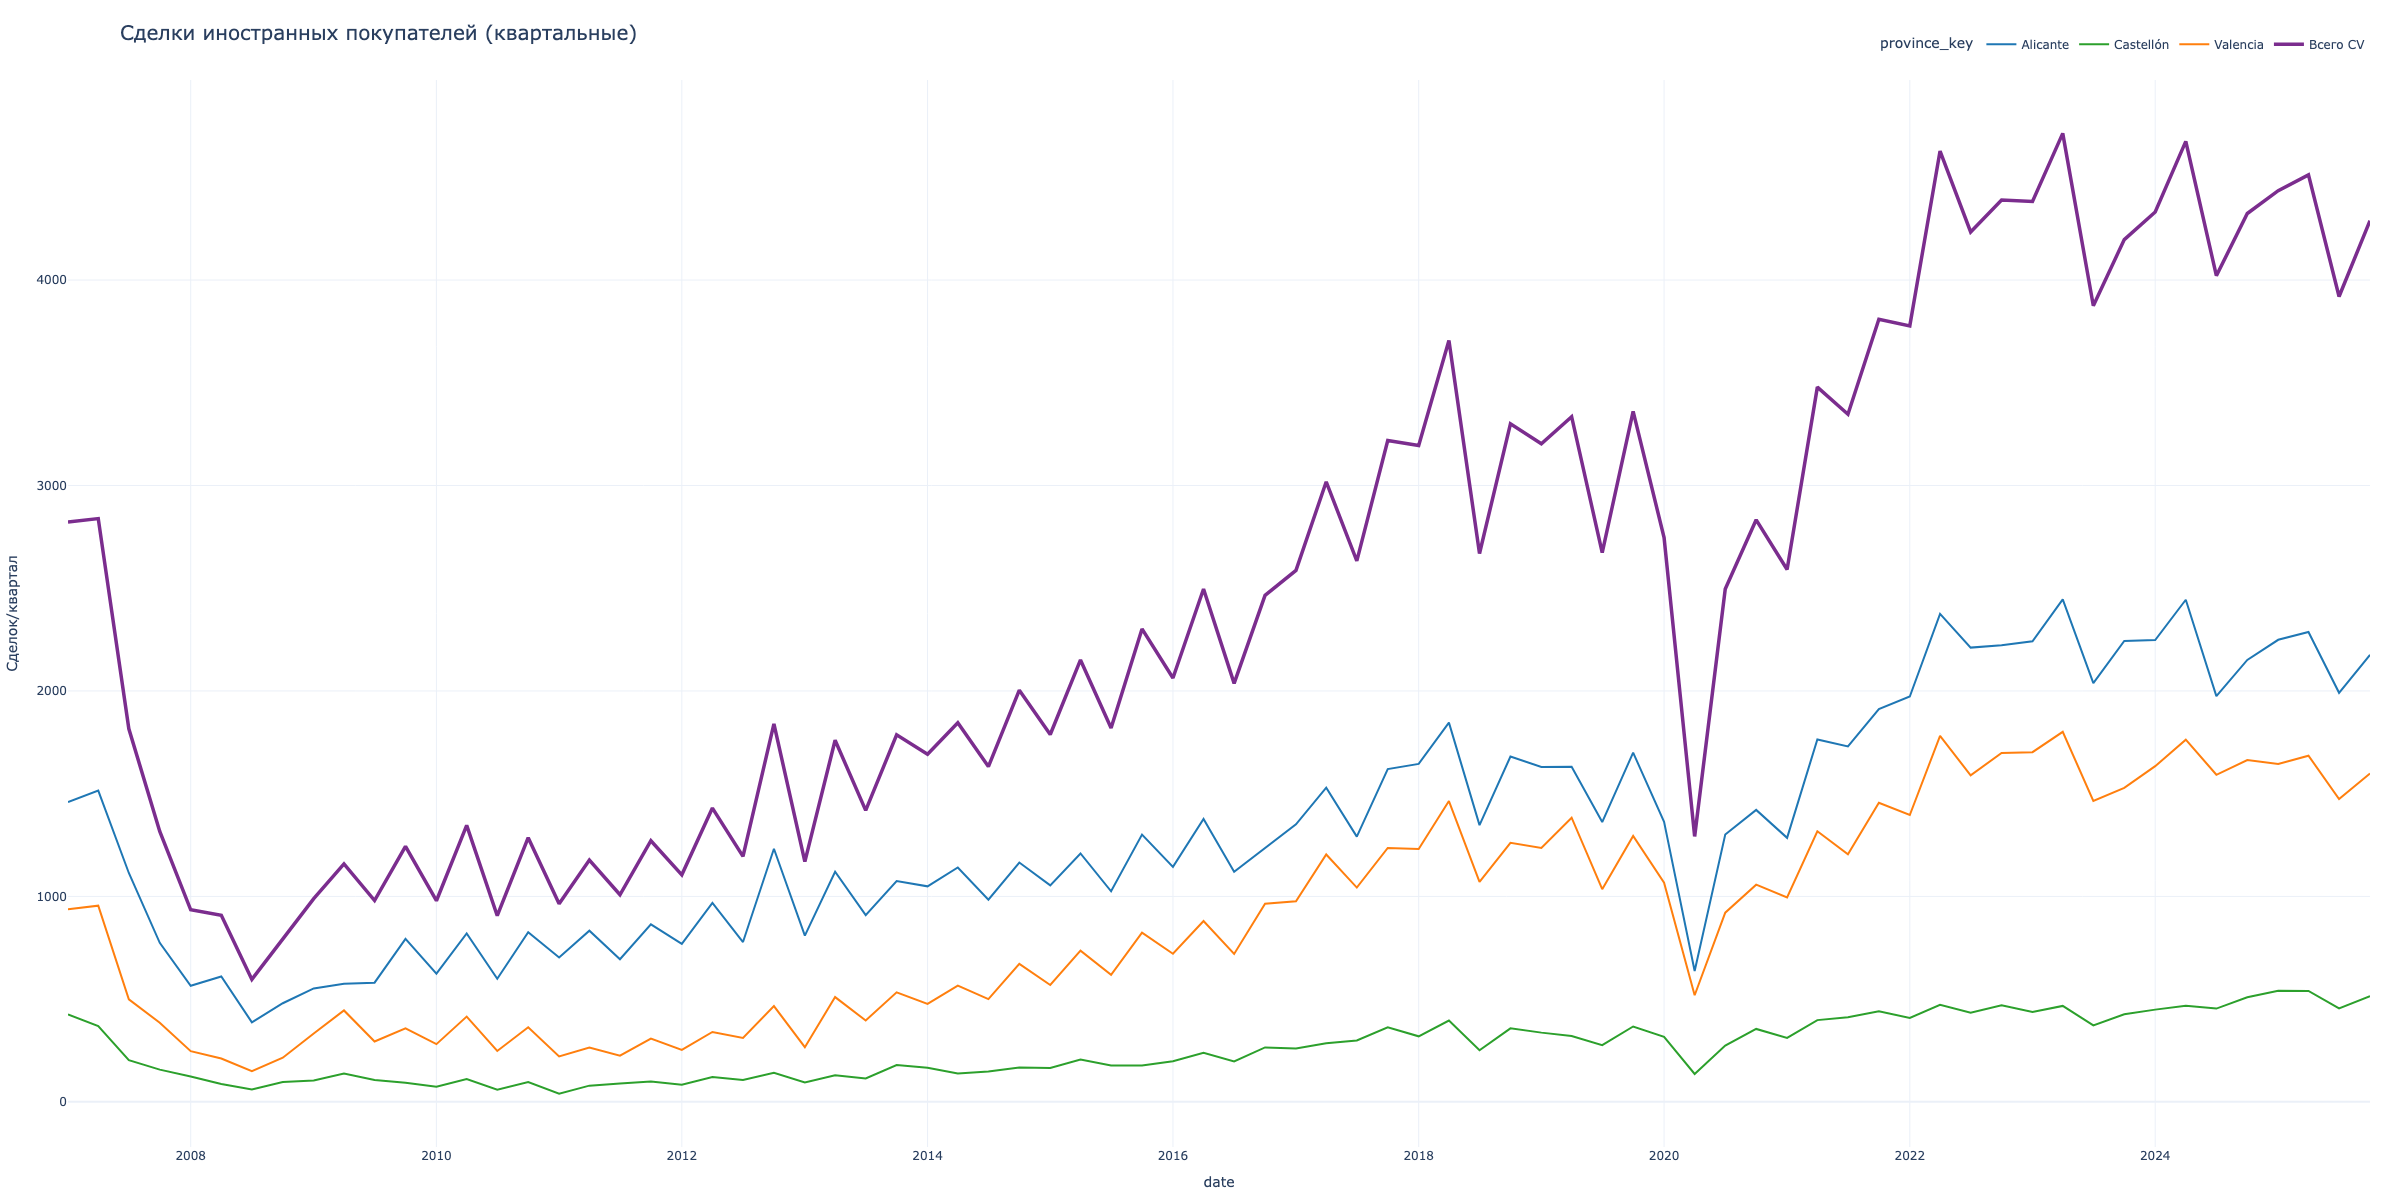
16% of the market. 17,000 deals/year. But they buy cheap.
| Year | Alicante | % | Valencia | % | Castellón | % | Total | % |
|---|---|---|---|---|---|---|---|---|
| 2007 | 4,862 | 9.6 | 2,776 | 6.3 | 1,155 | 8.9 | 8,793 | 8.2 |
| 2008 | 2,042 | 6.8 | 822 | 2.8 | 367 | 3.7 | 3,231 | 4.7 |
| 2009 | 2,500 | 10.6 | 1,430 | 6.8 | 441 | 5.2 | 4,371 | 8.2 |
| 2010 | 2,869 | 11.4 | 1,307 | 5.2 | 341 | 4.4 | 4,517 | 7.8 |
| 2011 | 3,094 | 14.6 | 1,019 | 5.6 | 307 | 4.8 | 4,420 | 9.7 |
| 2012 | 3,748 | 16.6 | 1,370 | 7.6 | 452 | 6.8 | 5,570 | 11.8 |
| 2013 | 3,913 | 16.5 | 1,705 | 11.1 | 517 | 9.0 | 6,135 | 13.7 |
| 2014 | 4,339 | 17.8 | 2,215 | 13.3 | 619 | 11.0 | 7,173 | 15.4 |
| 2015 | 4,589 | 17.1 | 2,747 | 14.5 | 725 | 12.9 | 8,061 | 15.7 |
| 2016 | 4,877 | 16.3 | 3,285 | 14.6 | 899 | 14.3 | 9,061 | 15.4 |
| 2017 | 5,791 | 16.1 | 4,459 | 16.3 | 1,207 | 16.1 | 11,457 | 16.2 |
| 2018 | 6,519 | 16.6 | 5,027 | 16.4 | 1,324 | 15.1 | 12,870 | 16.4 |
| 2019 | 6,323 | 17.2 | 4,948 | 16.9 | 1,301 | 15.1 | 12,572 | 16.8 |
| 2020 | 4,722 | 16.9 | 3,564 | 15.1 | 1,082 | 16.0 | 9,368 | 16.1 |
| 2021 | 6,691 | 17.7 | 4,973 | 14.4 | 1,562 | 15.2 | 13,226 | 16.0 |
| 2022 | 8,781 | 17.2 | 6,464 | 16.6 | 1,784 | 15.7 | 17,029 | 16.8 |
| 2023 | 8,969 | 18.5 | 6,496 | 17.8 | 1,703 | 15.8 | 17,168 | 17.9 |
| 2024 | 8,818 | 16.7 | 6,653 | 17.0 | 1,880 | 14.3 | 17,351 | 16.5 |
| 2025 | 8,703 | 16.0 | 6,402 | 15.5 | 2,051 | 14.5 | 17,156 | 15.6 |
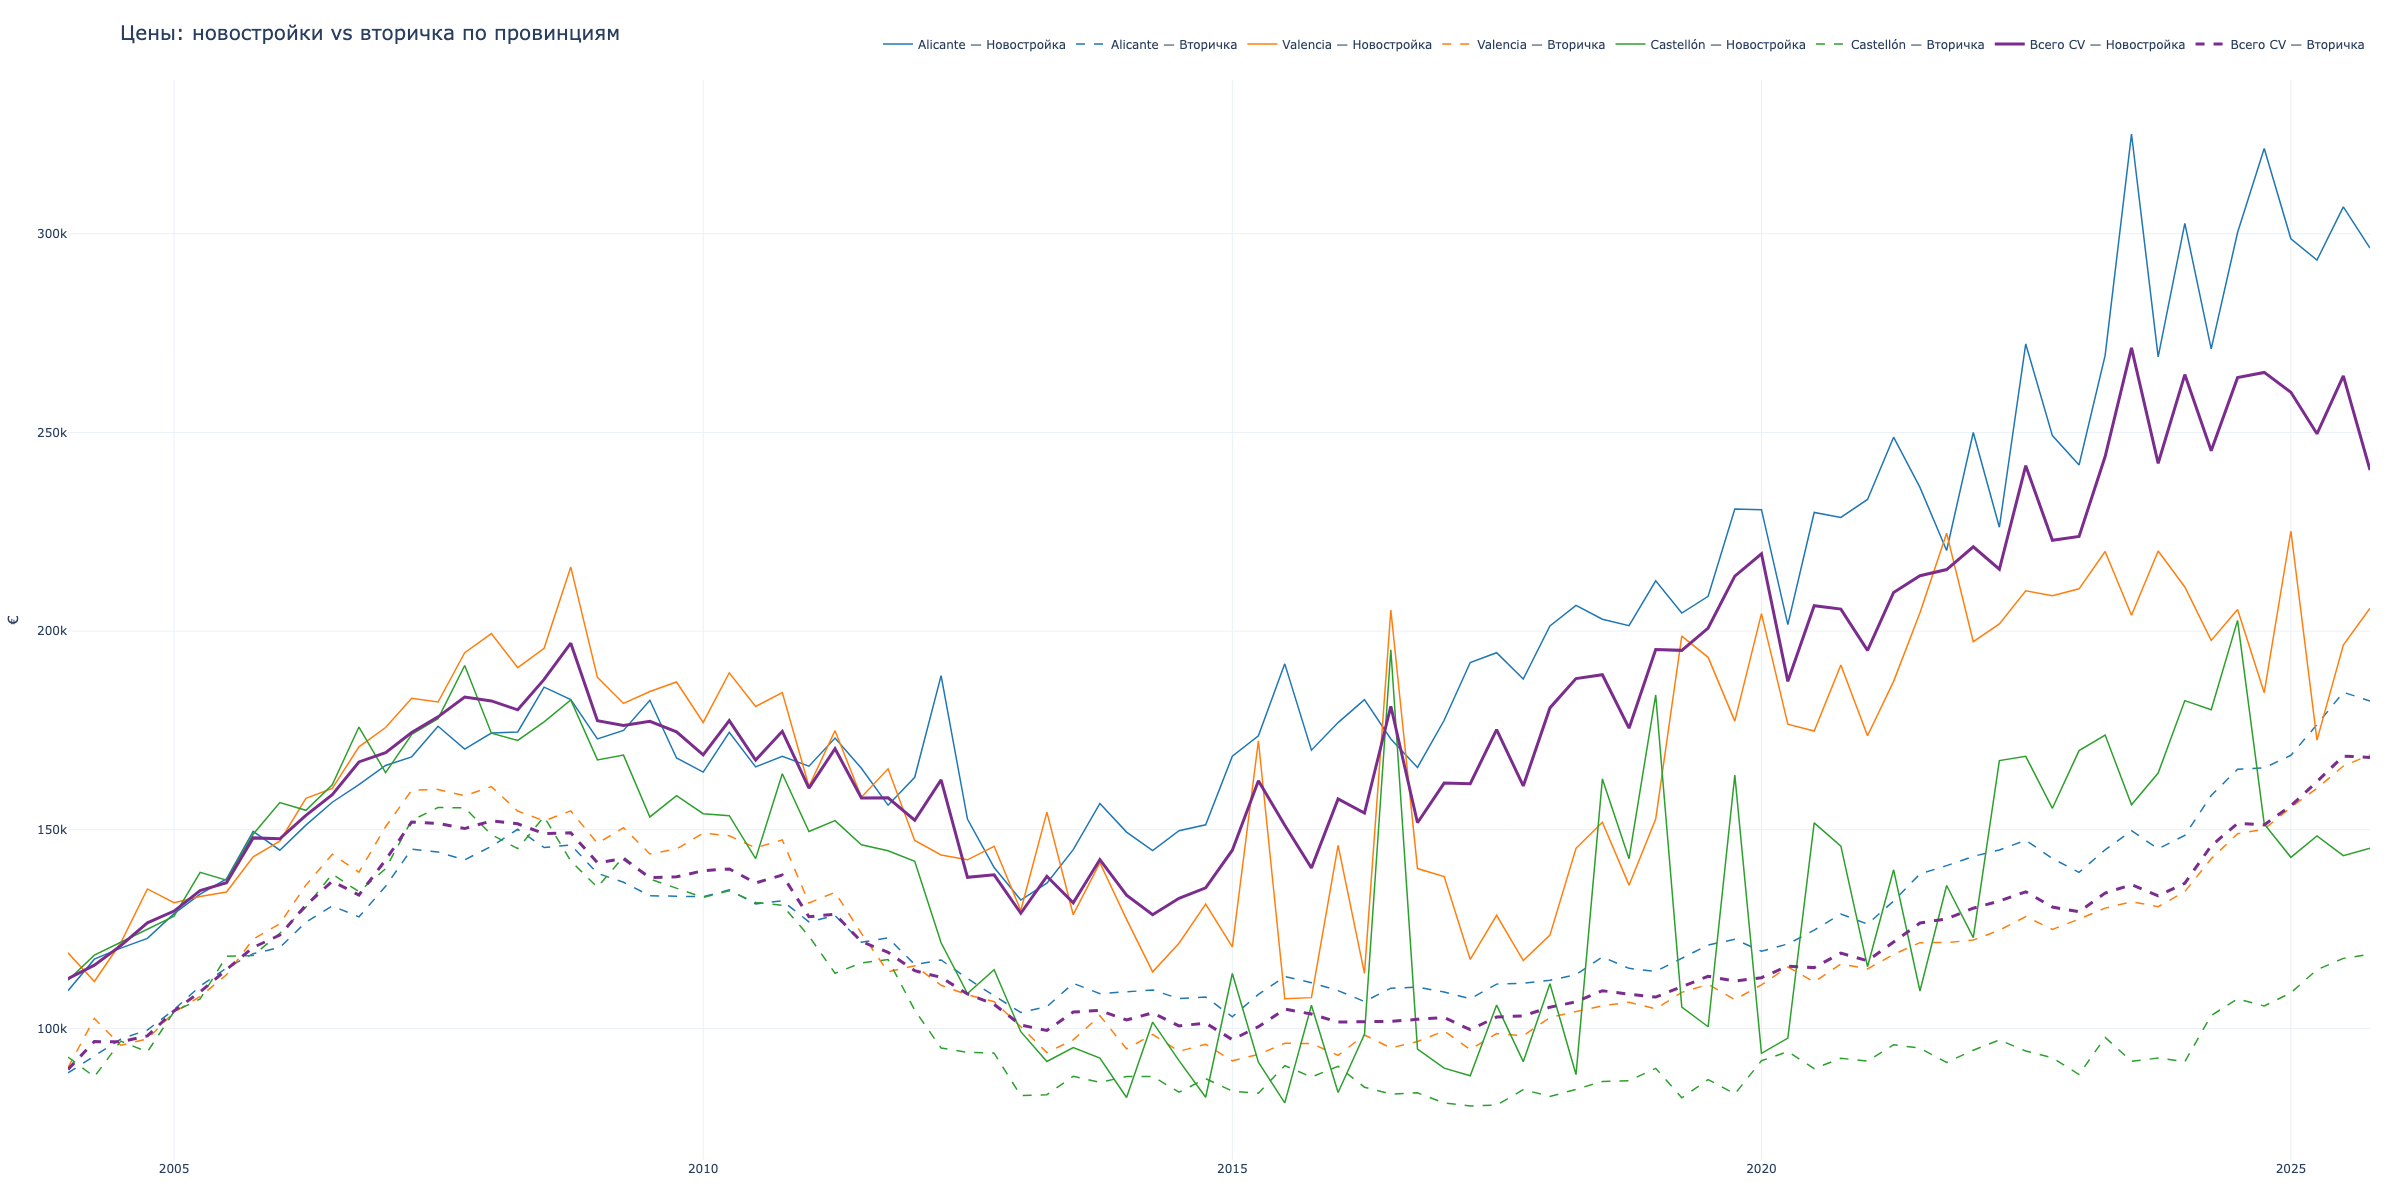
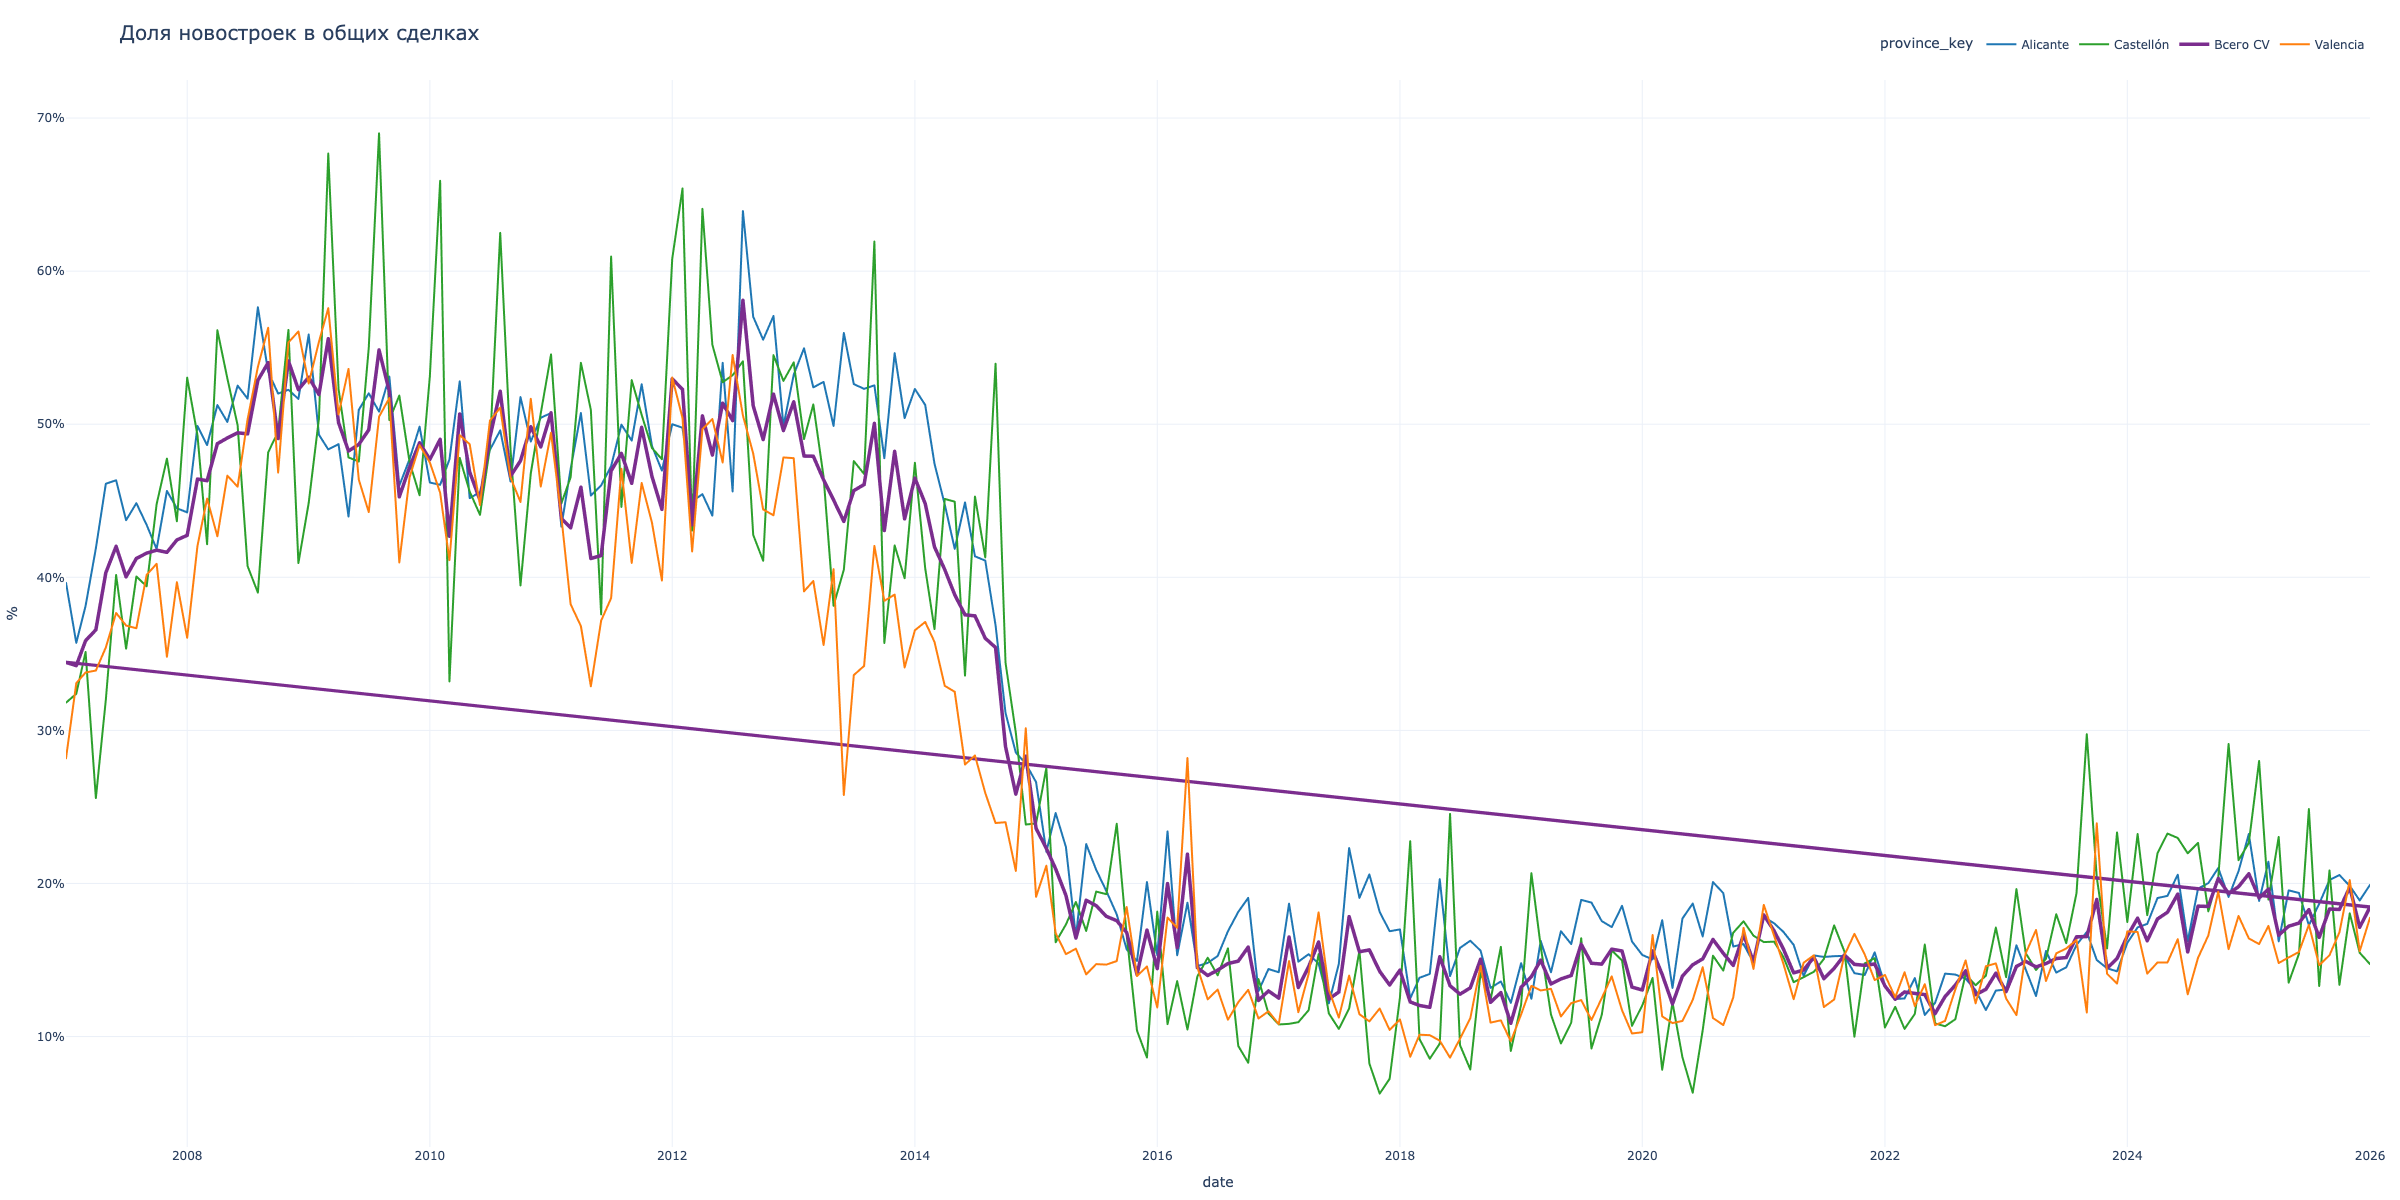
50% of the market in 2008. 18% now. Construction stopped.
So will it crash or not?
| Factor | 2007–2008 | 2025 |
|---|---|---|
| ECB rate | 4.25% → 1.0% | 2.5% |
| Mortgage bubble | 136-200%! | 56% (normal) |
| New builds | 50% of market | 18% of market |
| Cash purchases | few | 60%+ (Alicante) |
| Foreigners | 8% | 16% |
| Price growth | 10-15%/year | 10%/year |
Why it WON'T crash
- No mortgage bubble. In 2007, mortgages were 2x the number of deals. Now — 56%.
- Supply deficit. Little construction, but demand exists.
- Cash purchases. 60% in Alicante don't depend on rates.
- Foreign demand with external financing.
Why it might dip
- Growth +10%/year — 2006-2007 pace.
- Salaries +3%, prices +10%. Gap.
- Alicante already +16% above 2008 peak.
- Geopolitics could cut off foreign demand.
Verdict
- A 2008-style crash — unlikely. Market structure is different.
- Slowdown — inevitable. 10%/year growth is unsustainable.
- 10-20% correction — possible with an external shock.
- Alicante — most vulnerable (depends on foreigners).
- Valencia — most resilient (local demand).
Need this kind of analysis for your market?
Custom AI agents, analytics automation, data parsing from any source.